Saturday, December 4, 2010

Downwind faster than the wind


In July 2009 I wrote a post about wind-powered vehicles that travel directly downwind faster than the wind, giving links to videos explaining why this surprising idea is in fact possible.
I've now noticed that in July 2010 a fantastic team of enthusiasts fasterthanthewind.org indeed demonstrated a single-person wind-powered vehicle that goes more than twice as fast as the wind, directly downwind. Don't you just love engineers?!

Friday, December 3, 2010

Science, Engineering and Technology Award for DECC 2050 Pathways Team

DECC 2050 team members
At the Civil Service Awards last month, the Science, Engineering and Technology Award was won by the DECC 2050 Pathways Team for their work, which I highlighted in July.
From right to left, the photo shows Gus O'Donnell (Cabinet Secretary) giving the award to Katherine Randall, Tom Counsell, Clare Maltby, and James Geddes at Buckingham Palace. (To their left are two staff from the Government Office of Science.)

Sunday, October 17, 2010

Making numbers stick - desalination, melting, and boiling


I'm always looking for new ways to make physical numbers memorable.
  • One method is to use a picture (eg nuclear waste, per person, per year) [page 170, SEWTHA]
  • Another general rule is to choose units such that the answer to be remembered comes out between "1 unit" and "200 units", because smallish numbers are easier to remember.
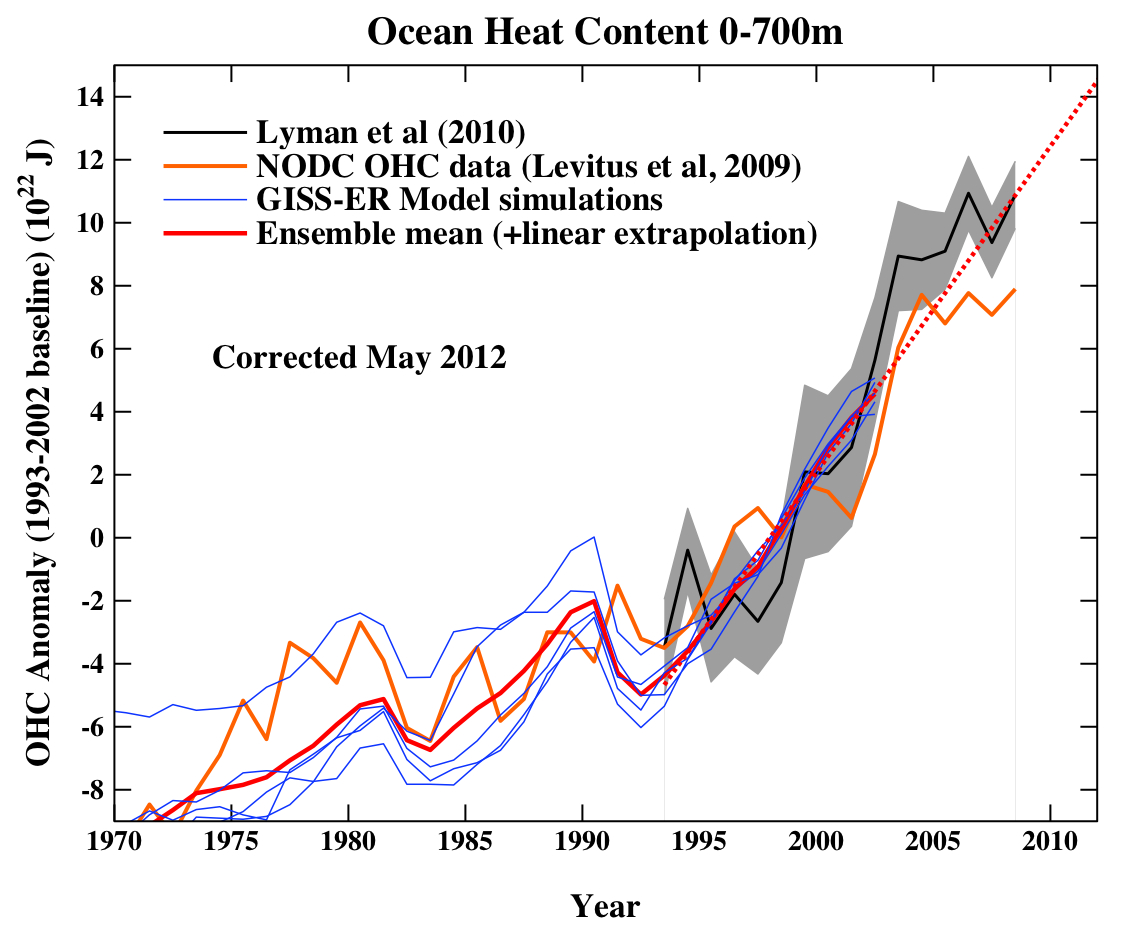
  • Another idea is to reexpress the quantity in completely different units, which may be more familiar and more memorable, as illustrated in this earlier post where I converted an incomprehensible 20 x 1022 J into a hopefully more human-friendly ocean temperature rise of 0.2 degrees C.

I'd like to give a few more examples of this trick, all converting unmemorable numbers in awkward units into temperature rises.
Example 1: the cost of desalinating sea water. [This method of making it stick came from Jim Gill, Chancellor of Curtin University, via Sam Wylie.] In SEWTHA (p 93), I report that desalination has an energy cost of 8 kWh per m3. A nice way to make this number more meaningful is to work out what temperature rise you would get if the same energy were put directly into heat in the same volume of water. The answer is ((8 kWh) / (1000 litres)) / (4.2 ((kJ / C) / litre)) = 7 degrees C.
This result brings home that if the desalinated water is going to be used for a shower or for cooking, the energy cost of the desalination is fairly tiny compared to the energy that will be used later in the water's lifecycle.

Example 2: melting ice. The latent heat of melting of ice is 6 kJ/mol, or 333 kJ per kg, a quantity I have never been able to memorise... until now! Using the same trick as above, we can convert this into an equivalent temperature rise, by dividing by the heat capacity. The answer is "the latent heat of melting of ice 'is' 80 degrees C".
I don't think I'll forget that number! It really brings home why mountaineers spend so much time melting snow. The energy to melt the snow is roughly the same as the energy to bring the melted snow up to boiling point!
Example 3: vaporizing water. We can apply the same trick to the heat required to vaporize water (2258 kJ/kg). The answer is (2258 kJ/kg) / (4.2 kJ/kg/C) in C = 538 C. This number violates the "should be between 1 and 200" rule, so it is not super-memorable, but it is quite striking, isn't it - whereas near-boiling water is 373 degrees above absolute zero, the energy required to actually boil it is equivalent to another 538 degrees of temperature rise! Maybe the best way to obey the "1-200" rule is to reexpress this heat once more, comparing it to the energy required to bring the water from 0 to 100 C. It is bigger by a factor of 5.4. So "the time for the kettle to boil itself dry is about 5 times the time taken to bring it to the boil".
Here ends the lesson.

Wednesday, September 8, 2010

'smart ways of seeing numbers' - the BBC like the 2050 Calculator!


In The BBC News Magazine, Go Figure, Michael Blastland says:
"If you've somehow missed it elsewhere, the DECC 2050 energy calculator is worth looking up."
Hurray!

Friday, September 3, 2010

New Energy Future


There's a new video on the Independent's website, made with the support of Channel 4 and Shell. It's one minute long, and, as seems to be traditional now, features me talking about energy and lightbulbs.
There's also a linked article in the Independent by Steve Connor, on "why achieving a cleaner energy economy involves a series of difficult choices", which quotes Sustainable Energy - without the hot air.

Tuesday, August 10, 2010

The 'zero' charger's footprint (Hot Air Oscars nomination, greenwart)

Here is a nice blog post by Blue Lyon, discussing the energy cost and money 'savings' offered by AT+T's recommendation to Turn your iPhone green with a new ZERO Charger.
Blue Lyon works out that the charger, which claims to use less power on standby, might pay for itself in 44 years, assuming it was displacing an old charger using 0.26 W, left plugged in all the time.
The makers of 'ZERO Chargers' are therefore nominated for the Hot Air Oscar for flagrant exploitation of gullible consumers.
One way to think about this is simply to look at the energy cost of delivery alone, assuming that the delivery involves one van making a 5-mile trip. Typing this into my firefox browser
5 miles / (13.1 miles per US gallon) * 10 kWh per litre in kWh
gives 14 kWh of transport energy to deliver the greenwart. That corresponds to the energy used by leaving the old charger in for 6 years.

Thursday, July 29, 2010

2050 Calculator Tool at DECC


I'm delighted to report that the Department of Energy and Climate Change has published the 2050 Pathways Analysis, which illustrates six possible energy pathways to achieve secure and affordable energy supplies in the UK while still hitting the 2050 target of reducing emissions by 80 per cent on 1990 levels.
These pathways were constructed with the engineering-based 2050 Calculator, which is now available as an online tool, and as a monster-spreadsheet that you can download, play with, and improve.
The Department is encouraging people to enhance this open-source tool, ideally before October 2010, so that it can in due course be used to engage civil servants, politicians, and the general public in 'grown-up' conversations, as Chris Huhne puts it.
The tool allows the user to explore the consequences - in terms of security-of-supply indicators and greenhouse gas emissions - of any combination of demand-side choices and supply-side choices. The intention of this 'play Secretary of State for Energy and Climate Change' approach is not to imply that the energy system could or should be centrally planned, but to help people understand the range of possibilities that are open to us; the trade-offs; the common themes shared by energy pathways that add up; and the scale of action required.
Here's one journalist's reaction to the tool [Independent]. And the Guardian. To understand what's going on behind the simplified front-end, please read the 2050 document and dive into the monster spreadsheet.
I'd like to praise James Geddes and Tom Counsell for their outstanding work in producing this tool, along with Jonathan Brearley, Graeme Cuthbert, Jan Kiso, Katherine Randall, Clare Maltby, and the whole 2050 team at DECC.

Friday, May 28, 2010

Ocean heat content, and useful units


The recent post at realclimate about measured increases in ocean heat content has an interesting graph whose y-axis is labelled in spectacular units, 1022 J. Even exajoules are not that big! (1EJ = 1018 J)...
One comment on that blog suggested it would be good to re-express in other units that are more familiar - say degrees Celsius, or watts per square metre.
Here goes...
The graph shows the ocean heat content increasing by about 20 x 1022 J in 40 years.
First, let's express the change in heat content as a average rise in temperature of the top 700 metres of the ocean (which is what was actually measured to make these graphs!).
Temperature rise = (Heat content increase) / (Volume of water) /
(Heat capacity)
= 20 x 1022 J /
(350 x 106 km2 * 700 m) /
(4.2 x 10⁶ J/K/m3)
= 0.19 K (or 0.19 degrees C).

Second, let's express the rate of increase in heat content in terms of a net power per unit area required.
Power per unit area = (Heat content increase) / Time / Area
= 20 x 1022 J / (40 years) /
(350 x 106 km2)
= 0.45 W/m2.

This can be compared with other things measured in the same units - see for example pages 20 and 170 in Sustainable Energy – without the hot air.
Hope this helps!

Sunday, May 9, 2010

SEWTHA online - Index added


I've added an alphabetical index page to the html edition of Sustainable Energy - without the hot air. I hope this helps! This index is identical to the version in the paper edition of the book, except that the page-numbers are clickable hypertext links.

Wednesday, January 20, 2010

Wind farm wakes

I'd like to highlight a stunning photograph and an interesting paper.

The image shows clouds forming in the wakes of the front row of wind turbines of Horns Rev wind farm.
The paper, Wake effects at Horns Rev and their influence on energy production, by Mechali, Barthelmie, Frandsen, Jensen, and Rethore, describes measurements of the effects of these wakes on wind power production.

The message of the paper is interesting. The downstream wind turbines lose 20% or 30% of their power, and sometimes even more, relative to the front row. The spacing of the turbines is 7 diameters.

Tuesday, January 5, 2010

'withouthotair' - Alternate website


The website withouthotair.com has gone down today (5 Jan 2010) and I am not sure why... anyway, there is a backup website at www.inference.phy.cam.ac.uk/withouthotair/. (Also known as tinyurl.com/sewtha.)
Thanks to friendly people for pointing out the problem.
Apologies for any inconvenience!